By Dean Weatherstone
This article was produced in association with Favero Electronics
The invention of the smartwatch means wearable data acquisition is available to all. Measuring our sleep, heart rate, step count and even stress level, we can be constantly gauged and evaluated. With consistent use, they can be useful in assisting you to lead a balanced and healthy lifestyle, or that’s what the marketing would have you believe. Data, data, data. There is seemingly no escape.
This trend is as rife in the sport of cycling. Strava has a reported 180 million subscribers worldwide. The indoor static trainer brand Zwift has 4 million users, and the global bicycle computer market is forecast to reach just shy of $1 billion in the next 5 years. Yep, it’s all data. If it is electronic, and most things seem to be heading that direction these days, chances are there is an app for that, which means data.
Latest Singletrack Merch


Buying and wearing our sustainable merch is another great way to support Singletrack
Data acquisition has become a growing part of mountain biking, particularly in competitive spaces. These days, it has become more like a MotoGP pit lane than a bicycle race. It is no longer accepted that riders should rely on feeling alone to gauge a bike’s tune to improve settings. Sensors strapped to the bike that measure your braking, suspension, and tyre pressures, to name just a few, are deployed to every measurable parameter on bikes in the World Cup mountain bike paddock. So much so, you need some serious experience to decipher the data and, in turn, transform it into a setting, ensuring the bike is in the best possible tune for any track or condition and translate this data into a race-winning pony. To go faster than the competition is now just seen as part of the racing.
The data acquisition doesn’t stop at your bike. Sensors are worn by riders, too. Heart rate monitors (HRM) plot your efforts. These have been popular for decades in just about every discipline of cycling, and I have been wearing one for training and racing for as long as I can remember. The heart rate monitor is a great tool for understanding your cardiovascular efforts, working within your training zones and monitoring your body’s recovery to assist in optimising your performances.
So aside from the suspension and braking data, what data could the average rider use to get faster, improve fitness and tidy up their mountain bike technique?
Power Meters
Today, the real weapon in every racer’s arsenal is the power meter. These are commonplace, particularly with racers in the endurance disciplines of the sport. Combined with your HRM, power meters can help you by measuring and managing your efforts. This is key to training, racing and pacing during your rides. The power meter will deliver the data you can use to discover how efficient you are. Unlike HRM, which can be influenced by many variables, power meters give you instant, consistent measurements of just how much work a rider is doing. So that means no hiding behind poor excuses.
In this article, I want to look at the types and technology used in power meters, the data that they produce and what they can offer and even possibly improve my riding and racing. I know that I will need to put in some time into this, but more worryingly, some painful efforts to understand the numbers and just what I am capable of, to see if I can teach an old dog new tricks when it comes to my riding, training and racing. I am sure there is more to it than just bolting a power meter to my bike and it will make me faster. There will be an element of geeking out and understanding what the numbers mean, as well as how best to use the data.
For some perspective, I have been racing at an amateur and mediocre level on and off across just about every genre of off-road riding. Starting with downhill when I was younger and braver, I moved on to enduro and then, more recently, gravel and XC. I have been happily picking my battles in the mid-pack in my age category for the past 6 months. I try to fit in training whenever I can around work and family to be in the best shape to ride and compete. I know racing isn’t for everyone, which is why I’ve started this experiment to see if there is a place for data among all types of riders.
What is power?
Simply put, power in cycling is the product of Torque per Cadence. Torque is the strength exerted by the cyclist on the pedals, while cadence corresponds to the pedal stroke velocity or revolutions.
There are several types of power meters on offer nowadays, each with its own set of drawbacks and benefits.
Spider-mounted power meters are only ever single-sided. As the name suggests, they are mounted on the chainring spider on the drive side crank and use software to make the calculations and compensations. However, mounting a power meter in this location goes some way to preventing damage such as rock strikes.
Axle-mounted power meters are placed inside the hollow axle of your crankset. Well out of harm’s way, reducing the risk of trailside strikes and lessening the chances of damage from water ingress. These power meters are also only single-sided, so accuracy needs to be compensated with electronic wizardry.
Another wattage wonder avenue to trundle down is crank arm power meters. Usually found mounted to the inside edge, closest to the frame. Although usually shaving a few grams from spider-mounted designs, this location might make for potential frame clearance and component compatibility issues.
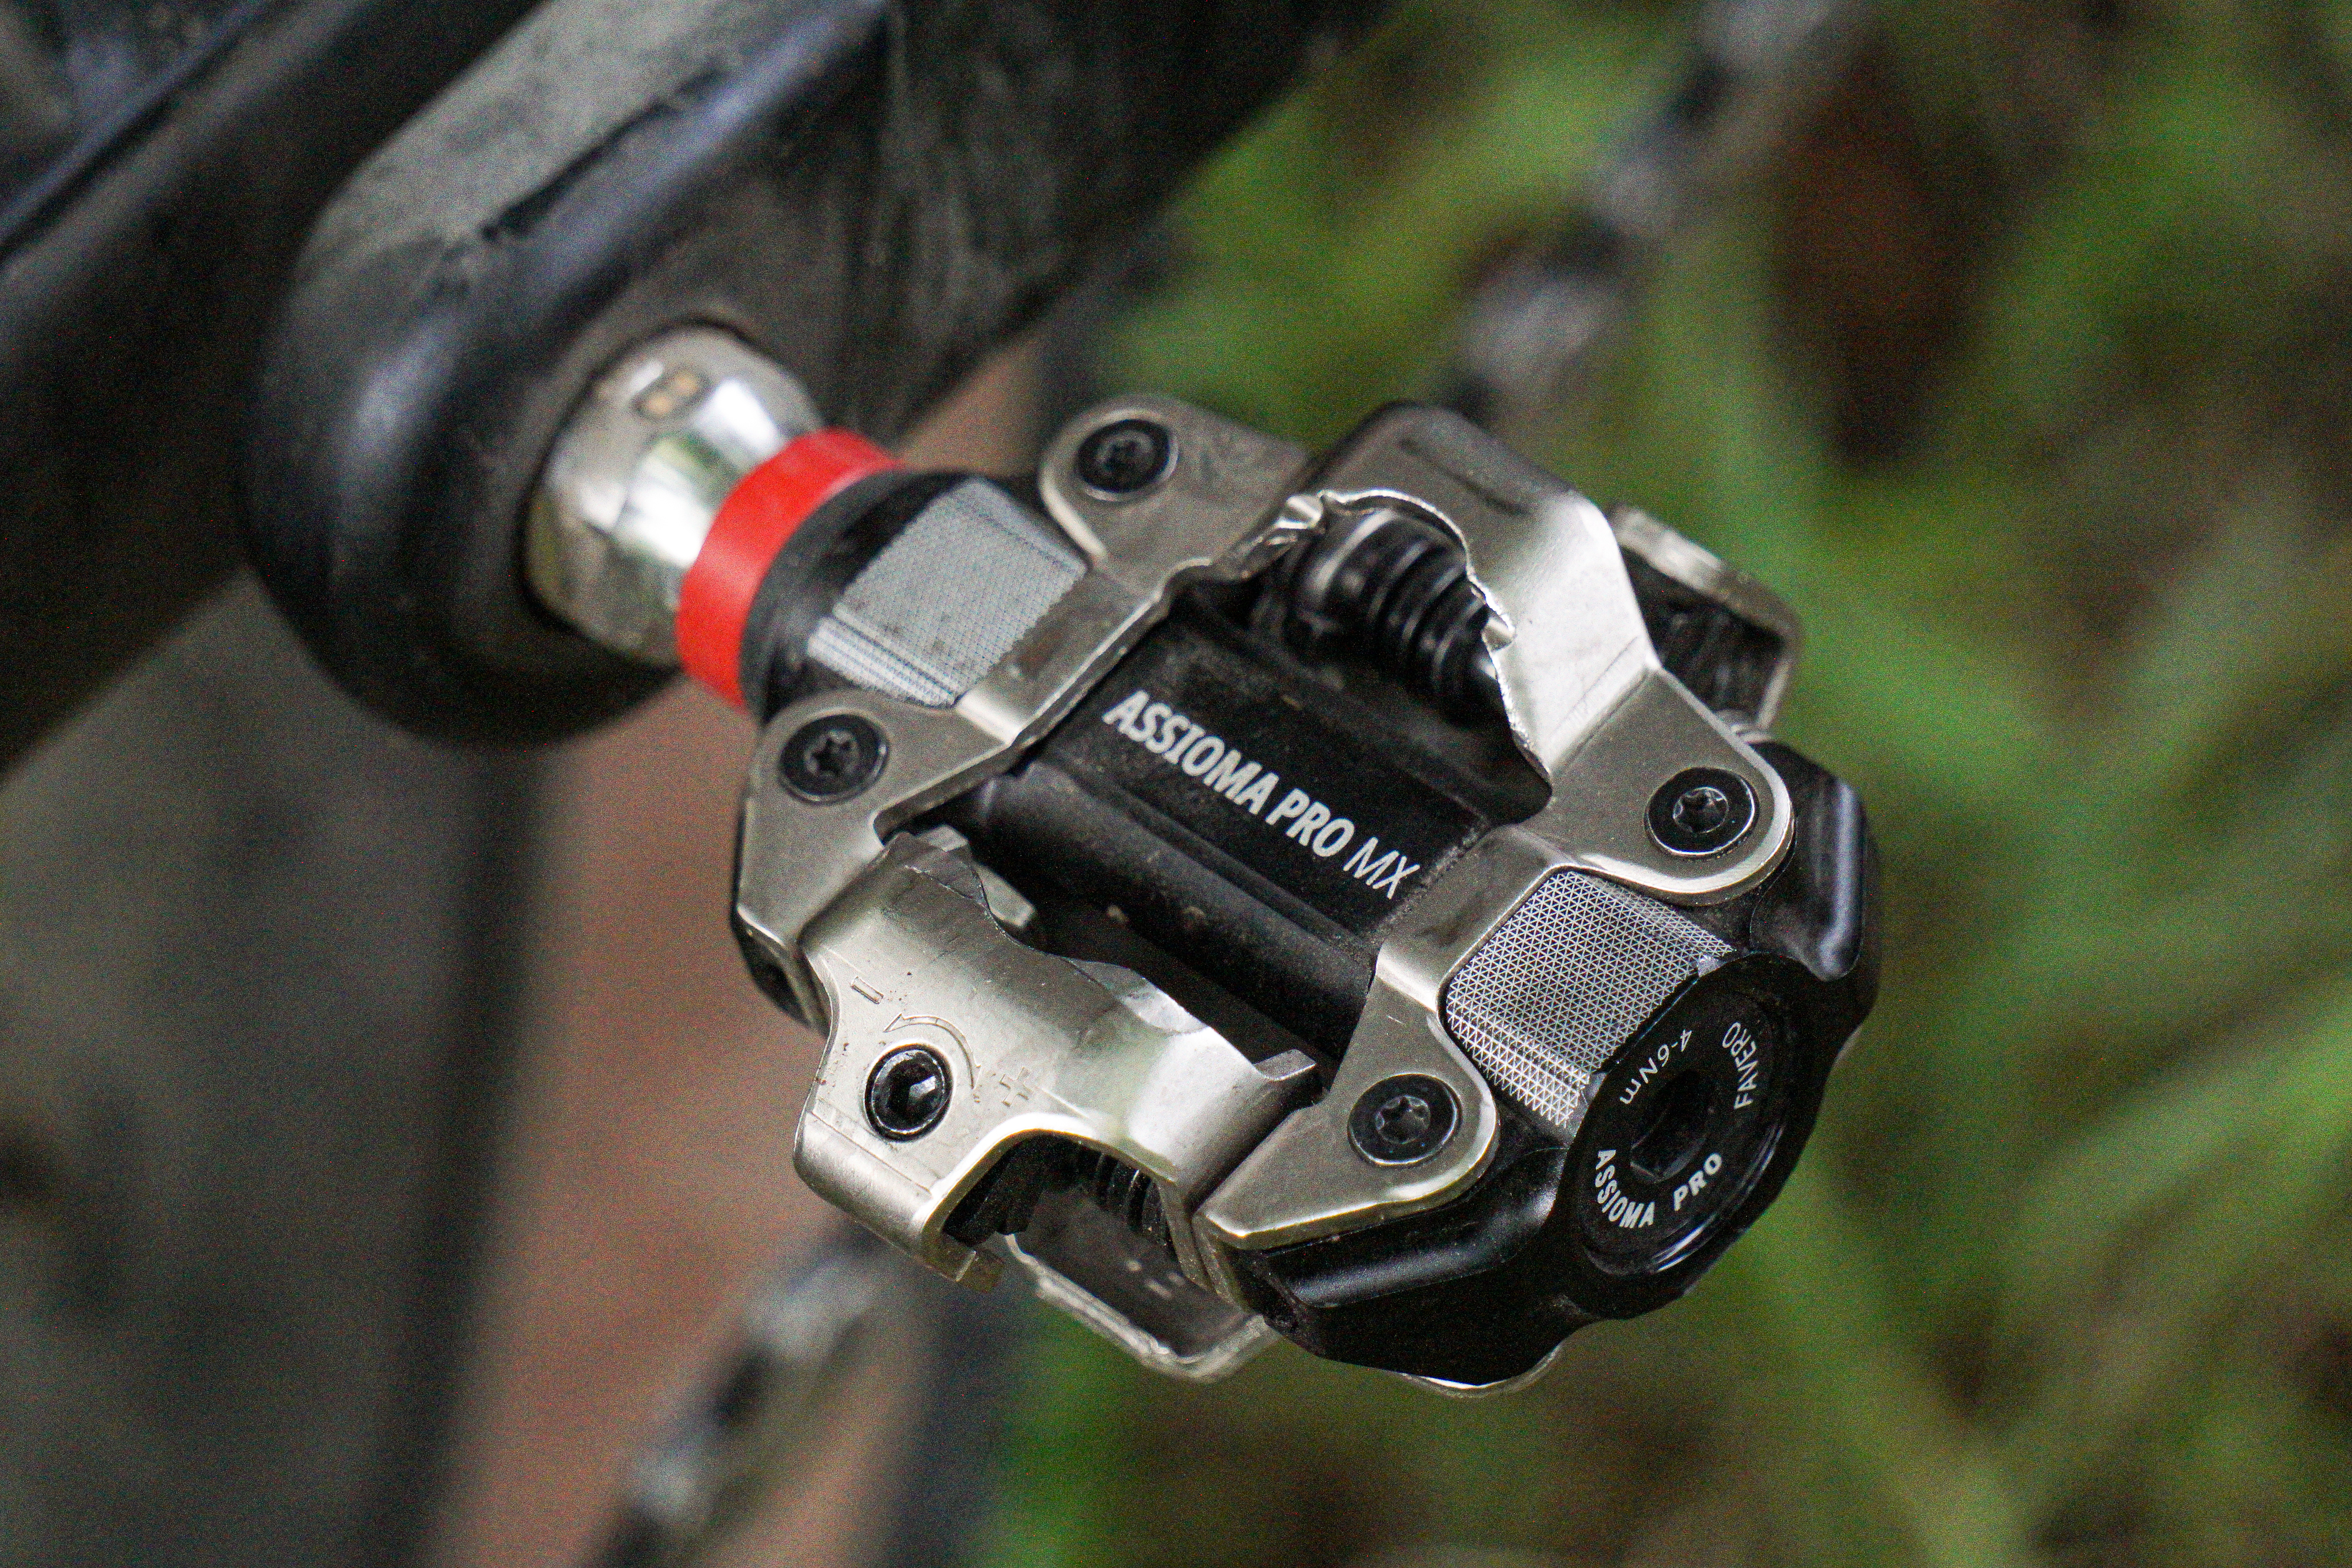
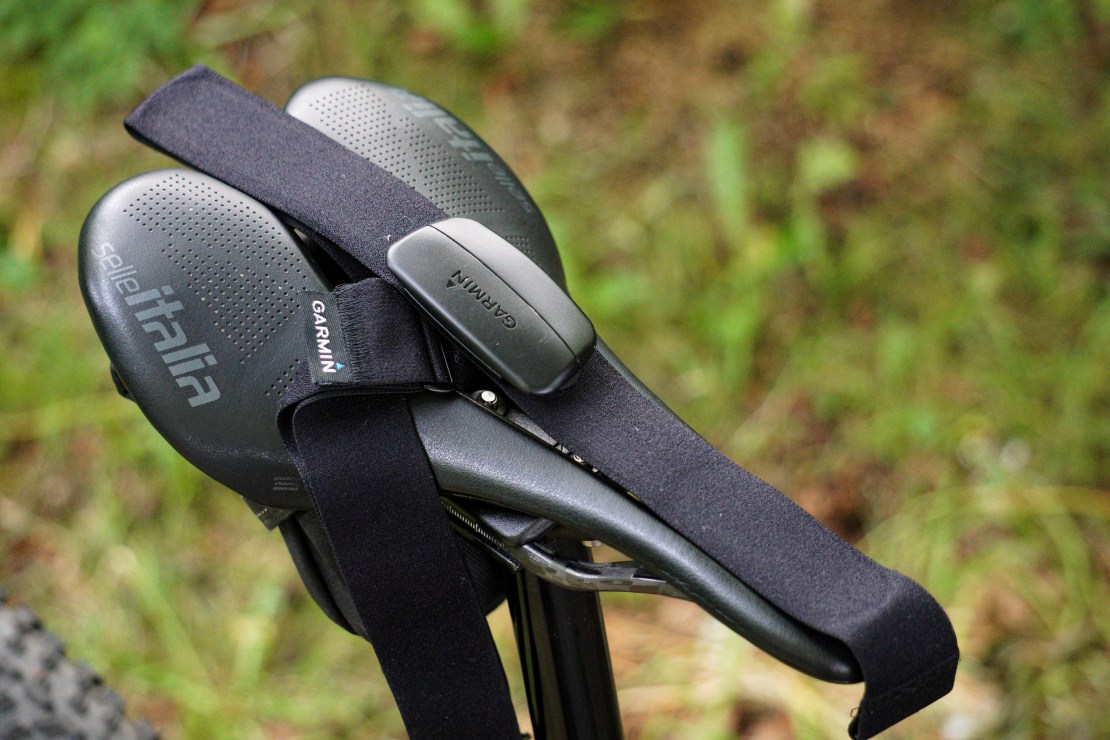
Power meter pedals like the ones I have been using from Favero Electronics are the most versatile option. Even for the least accomplished home bike mechanics, it is as simple as changing your pedals. This solution can be easily switched between different bikes if you are fortunate enough to own more than one bike.
Power meter pedals are also available in single or dual-sided options, depending on your level of spend, but you will have to expect a limit to the amount and type of data that can be gained from a single-sided pedal power meter.
Favero Power Meter Pedals
The power meter that I have been using is from Favero Electronics in Italy. I am using the dual-sided Assioma Pro MX-2 version (£599). Favero also offers the Assioma Pro MX-1 single-sided option (£399), saving a few quid at the expense of the ultimate amount and type of highly accurate data. Should riders using the Assioma Pro MX-1 single-sided power meter pedal wish to eventually rank up to a dual-sided spec at a later date, Favero has your back with the Assioma Pro MX-UP optional upgrade kit for £369.

Whilst we are talking accuracy (and here comes some of the nerdy stuff), Favero boasts figures that are accurate to ±1%. The torque generated during pedalling is measured hundreds of times a second during the rotation of the cranks by sensors on the pedal spindles called strain gauges. Power meters normally do not measure the real angular velocity, but only estimate, usually an average value, for every revolution. But as each pedal stroke is not perfectly smooth and regular, it introduces a margin of error in the power calculation up to +4.5% for the declared accuracy. But Favero stands out from the other power meters on the market. The Italians deploy technology that they call “Instant Angular Velocity-based Power Calculation”. Favero uses this to leverage its integrated gyroscope, and it is capable of detecting the Instant Angular Velocity (IAV) during the entire pedal stroke, removing the guesswork. Clever stuff.
The smart tech in these pedals doesn’t just stop there. The sensors also collate data on rider position, whether you are seated or standing. It can detect which part of the pedal stroke is producing power and where your peak power is unleashed. Great if you are looking to tidy up your form or improve your pedal stroke efficiency. And finally, the Assioma sensors can also produce numerical data on exactly how the force is distributed across the pedal body during each stroke. All IAV cycling dynamics data is visible on any ANT+ cycle computer or, of course, on the Favero Assioma smartphone app, except the Rider Position.
The Favero Assioma Pro MX power meter pedals that I have been using have a rechargeable battery inside the axle that lasts more than 60 hours on a single charge and is easily topped up with juice by simply connecting the dual-ended cable to each of the pedal axles and charging them both simultaneously. The ports are located between the pedal body and the crank arm. The charging lead ends are magnetic to ease locating on the pedals and will slot into any USB charging socket at the other end.
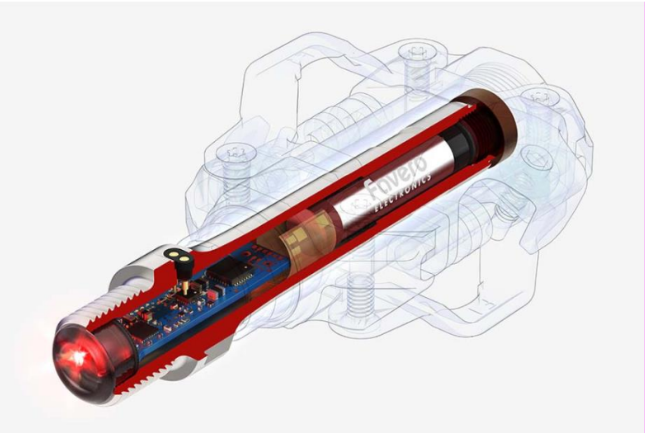
Other noteworthy technical features include a fully rebuildable construction. The cost of a replacement pedal body in the event of damage is a snippet over £40. The axle of the Assioma Pro MX pedal is where all the tech, sensitive electronic circuit boards, strain gauges and rechargeable battery are housed, and this means zero chance of power dropouts due to all the electronics being safely housed inside the spindle. This makes these pedals unique. Other brands separate either the strain gauges or the battery from the rest of the electronics. This separation creates potential data inaccuracy. The pedals are completely compatible with Shimano SPD cleats and only weigh 40 grams per pedal more than my Shimano XTR pedals that they replaced on my cross-country mountain bike.
Power Training
So now I have my power meter installed on my mountain bike, now what? Just because you have a power meter, it doesn’t mean you are going to instantly turn into Evie Richards or Charlie Aldridge. It will take time, training and understanding to turn the data into results. So, what is the data specifically? What do we do with it? How can we use it to transform our riding?
Just some of the data metrics that are most useful to work from include maximum or peak power, your functional threshold power, or more commonly known as F.T.P., then there is power to weight (Watts per kilo) and also normalised power and average power. Combined with the maximum and average heart rate recorded, these numbers give riders and coaches the key data markers to set training zones and monitor performance.
Normalised Power
There could be a case to argue that this is a more useful metric to measure the effort and intensity of a mountain bike ride than average power. Average power could severely underestimate the demands of a ride. With N.P., it is a far more accurate way to measure effort, especially on rides like XC races, where you might see a surge in power during attacks or in short, steep climbs, but then may see coasting during technical descents where pedalling isn’t possible.
Watts per Kilo
This is as simple as it sounds and is a well-used metric to determine a rider’s power-to-weight ratio. This is also useful to understand, especially as, unlike some road riding, almost all mountain biking endurance rides will inevitably contain ascending or climbing. The better your power-to-weight figure, the bigger your advantage can be on the climbs. Whilst the highest possible peak power data produced by bigger, more muscular and anaerobic riders might help you sprinting out of a start on a downhill race and during any flat terrain cycling disciplines or on the track, but for racing with any ascending involved, there is more importance on watts per kilo data metric.
We can look at my data as an example calculation. I weigh 68 kg, and my FTP is 245 watts
W/kg = 245 W ÷ 68 kg = 3.6 W/kg
To improve this data, you would need to lose body mass or improve your F.T.P. To do both could yield significant progress. However, there is a risk that if this is not done in a way that balances, you may risk losing weight and the ability to produce the power figures required to boost that F.T.P figure upwards.
Peak Power
Peak power is the metric used to determine a rider’s power output during an all-out effort, typically lasting less than 30 seconds. The data here is crucial to understanding your anaerobic ability during sprints.
Testing, Testing 1,2,3
To fully understand and embark on this data journey, first of all, you will need to put yourself through some form of test. Yes, test, and it will be as painful as it sounds. There are a couple of ways to test your potential, and the figures produced will be close, but ultimately will depend on what you want to achieve. Both will still be able to assist you down the road. Numerous websites can aid you in understanding the differences and the benefits and drawbacks of either.
Critical Power Test
You can complete a critical power test. This includes a series of efforts that should ideally be performed with a full recovery (24-48 hours rest) before embarking on the next. Before each session, you must be fully warmed up, so aim for 20 minutes with a few 75-80% efforts thrown in during that time.
Once the warm-up is completed, on the first day of the test, you should perform an all-out maximum effort for 3 minutes. It doesn’t sound like long, but it is as hard as you can go, giving it everything in your locker. Then a warm down. Record your average power output for the 3-minute effort.
Then, after you are fully rested and recovered, attempt test two. This time it will be an all-out effort for 12 minutes. Record the test’s average power. And finally, once recovered from that, you can take on the final test, a 20-minute full effort. Record the average power from that session.
Take all the average power data from each test and input it into a Critical Power calculator online to gain your C.P. figure.
This is the most scientific method and is one often used by professional performance coaches. But this will require you to complete multiple of your maximum efforts on different days. I would use the critical power test if you are looking for the most accurate and detailed power figure, and also a W (anaerobic Work capacity measured in kilojoules) number. This gives you a figure of just how much energy you can expend above your Critical Power during short burst sprints on climbs or during attacks. As these are anaerobic efforts, they are not reliant on oxygen and produce quick energy, but these efforts are not sustainable. This test is best suited for training for XC racing, as it works to improve your anaerobic threshold data. It is the name of the XC game, helping you to pace during the race, but more importantly, pushing up your ability to spring anaerobic short, powerful attacks and make moves on your competition.
Functional Threshold Power Test
Alternatively, I used the Functional Threshold Power or F.T.P. test. The reason I chose this test is that I am only just starting on this journey, so I went for simplicity to begin. Just like any test, you will want to be well recovered and rested before starting.
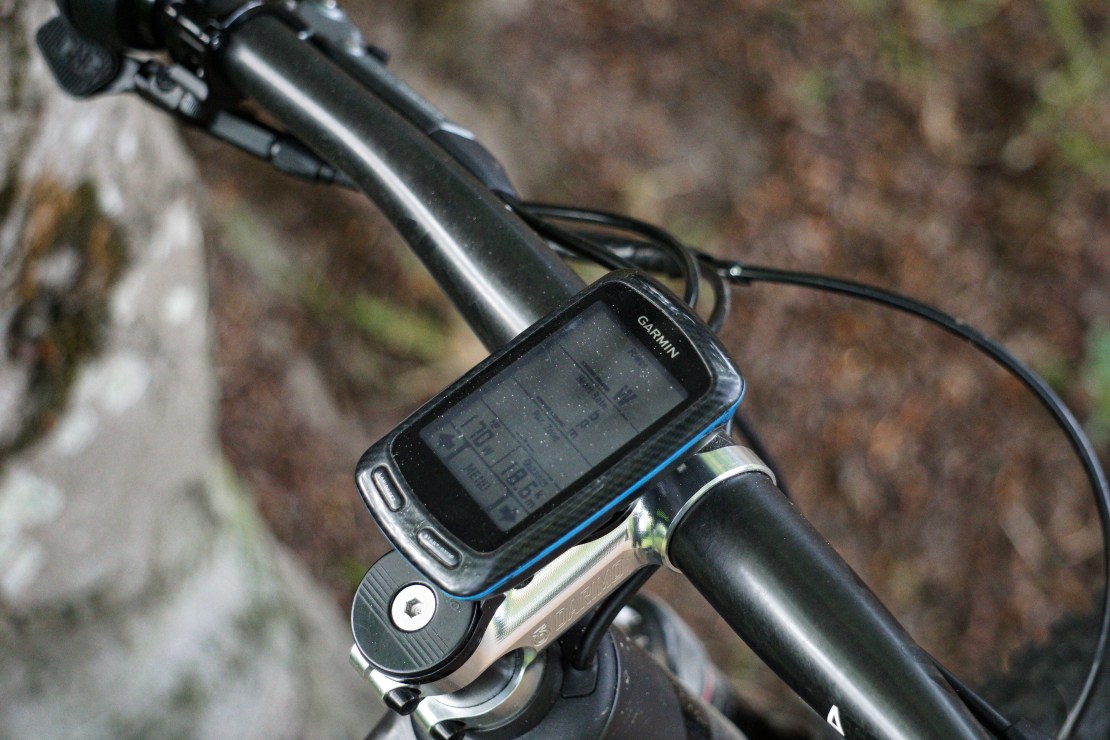
I have until now shied away from indoor static trainers, so I will be conducting this test out in the real world. With the assistance of climbfinder.com, I searched for a steady and consistent road climb that I knew would last me the duration of the FTP test. I had spent some time beforehand ensuring that my Garmin display had been customised to show me both the current power and average power, as well as a timer for my test. I also did some homework on how best to attack the test effectively. Should I push as hard as I can until I blow up and risk not making the full 20 minutes, or should I deploy some kind of pacing, with a target power figure? I settled on trying to stay above 250 watts for the duration of the test. It was only my first of many attempts, and I needed a base to see how it feels and to just get a score on the board. After all, there will be more testing to come in the weeks ahead.
Fast forward to the day of the test. I first completed a 20-minute warm-up, including three 80% short efforts for up to a maximum of a minute, which were spaced out over the warm-up period. I then returned to my car, shed a layer of clothing, set my Garmin to record, and set out on a 20-minute test effort. The reason you don’t just test over a 60-minute duration to calculate your threshold power data is that it is difficult to conduct this type of test, with this level of intensity, consistently.
Once the taste of blood had subsided, I rolled back down the hill to my car and uploaded my test data. The result was 258 watts of average power for 20 minutes. That then needs to be divided by 0.95 to get my F.T.P of 248 watts. This figure is the theoretical power that I should be able to maintain for one hour.
The difference between Critical Power and FTP is the latter is simpler but less physiologically precise; it doesn’t account for anaerobic contributions to the data as C.P. does. So, F.T.P. can misrepresent if you have a higher or lower anaerobic capacity.
Data Download
Now you have the data recorded on your cycle computer, what’s next? With the average power numbers recorded during your test, you can calculate your threshold power capability. This is the maximum average power figure you should be able to sustain for 60 minutes. This figure will now help you to have an idea of your power zones for training. These zones are split into seven levels.
| Zone | Name | % of FTP | Purpose |
| 1 | Active Recovery | <55% | Very light effort; aids recovery and flushes metabolic waste. |
| 2 | Endurance | 56–75% | Builds aerobic base, enhances fat metabolism, and prepares muscles for longer efforts. |
| 3 | Tempo | 76–90% | Improves muscular endurance and aerobic capacity; suitable for sustained efforts. |
| 4 | Threshold | 91–105% | Increases lactate threshold, enabling higher sustainable power output. |
| 5 | VO₂ Max | 106–120% | Boosts cardiovascular system and VO₂ max; enhances time-trialling ability. |
| 6 | Anaerobic Capacity | 120% | Develops short-term power and sprinting ability; improves ability to break away from competition. |
| 7 | Neuromuscular Power | Maximal | Enhances explosive power and sprinting ability; develops neural control of pedalling at specific cadence. |
These zones, combined with your power and heart rate data, enable you to optimise your training to focus on specific attributes to improve your riding performance. Now that I have compiled my data and updated my training zones on my cycle computer, I can add more precise interval sessions, rides, and not forget those all-important rest days to my training to produce a plan.
To recognise physiological adaptations to my training stimuli over the coming weeks in my plan, I will schedule and retest my F.T.P every four weeks, and adjust my zones accordingly to ensure that I am getting the best out of the data. This process of regular tests will give me measurable data, allowing me to quantify any improvement.
Watt Improvement?
Have I noticed an improvement in my riding, racing results or my fitness?
From my recent foray between the tapes whilst using my Favero Assioma Pro MX-2 power meter pedals, I found that after assessing the race data, I struggled to extract my full potential. My strategy was to start within my numbers and save something in reserve for the last lap and a half. I spent too much time trying to maintain a pace using my FTP number. I was concerned that, as this race was longer than I had completed previously and in a more competitive field than usual, I might not be able to make it to the finish.
I can see that edging on the side of caution rather than unleashing my full fury, as it were, meant that I didn’t quite reach the numbers that I know I am capable of. The intensity of my effort was consistent with my heart rate staying in Zone 4 or higher (greater than 94%) for the duration of my five lap XC race. Call it race day nerves, lack of preparation or being too passive during the race, meant my power numbers that are more on the conservative side than I would have liked. Onto the next race, with more experience and understanding of my data and ability.
One thing I have realised is that improvements are difficult to quantify without data. Race results can be marred with laps riddled with mistakes, and as I have found out, most often the mistakes of my fellow competitors. These results can be affected by form and injury, which is far more relevant for professional bike racers who are competing over a season with target events that might suit their physiology best.
Now that my eyes have been opened to this world of numbers, my training is more considered and focused. I have areas that I have been targeting, like improving my watts per kilogram. I have been looking to increase that F.T.P number upwards with interval training and sprints. Whilst steadily keeping a beady eye on exactly what I am consuming calorie-wise, with a focus on the training and ride day calorie intake to ensure that I am fueling sufficiently for the duration of the ride, but also to aid my recovery.
All this data is very personal. Whilst bragging to your buddies is tempting, I have been asked on occasions since starting my data journey. “Come on then, what is your F.T.P?” The number is mine, and this figure is just a snippet of a much larger picture. I don’t have the most muscular physique, so my power figures won’t place me close to an Olympic track sprinter like Sir Chris Hoy. Yes, there is probably room for improvement, but I still need to strike a balance between my family life, work and riding. But I have lost a little excess weight, my fitness has improved, and my numbers are heading in the right direction. I feel that I am more comfortable on longer rides, having data on hand to aid my pacing alongside a better understanding of my hydration and fuelling during multiple hours in the saddle.
Working on my power figures has given me more self-belief and a deeper understanding of what it feels like to be on my limit. It means that I can look to hold the wheel of the front group, which was something I was struggling to do for more than just the first lap in a race.
Power meters are expensive. Whilst the prices are beginning to come down slowly, you can expect to pay upwards of £400. It probably isn’t the first area of a bike that would get my hard-earned cash if I were looking to upgrade my bike. You certainly cannot just bolt a power meter into your bike and feel the benefit like you would with a good set of tyres or even just giving your bike that well overdue service.
Some time spent with a qualified skills coach would go a long way to improve most riders’ technical ability. But if you, like me, are looking to make the most of your time, then a power meter it is a valuable asset and the best tool to put some impetus into your race training.
Power meters, heart rate monitors and cycle computers are a luxury and not a necessity. They are a training tool and useful for pacing your efforts. This can be put to best use on those ultra-long-distance events or if you go out of the traps at hypersonic speed, only to struggle to make it to the finish line.
For me, all this data isn’t something that can be consumed easily while you are mountain bike racing. Taking your eye off a technical trail for a peek at those peak numbers isn’t the smartest idea. So, unless you are using the data on your bike computer to manage your effort (power and heart rate) on a long and sustained climb, it means you would be required to study the numbers after the ride has ended to gain your data insight.
The data and the numbers are only part of this equation; it’s a feeling, a process, a journey. It will take investment of (money and) time to get started, more to put in the tests, training sessions and then even more to sit and learn to transpose the data into something that you understand and is relevant. But this is one journey that I am glad I started on.
For more information on the Favero Assioma PRO MX-2 and MX-1 pedals visit Favero Cycling
Dean’s Data
Real world data examples from my time with the Favero Assioma PRO MX-2 pedals.
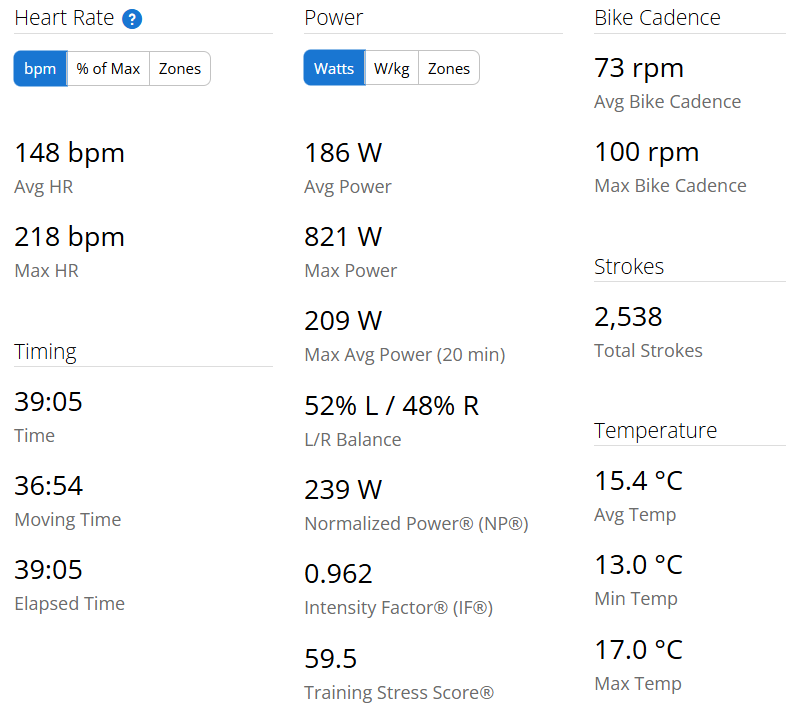
Heart rate and power metrics displayed on a cycling performance monitor detailing average and maximum values.
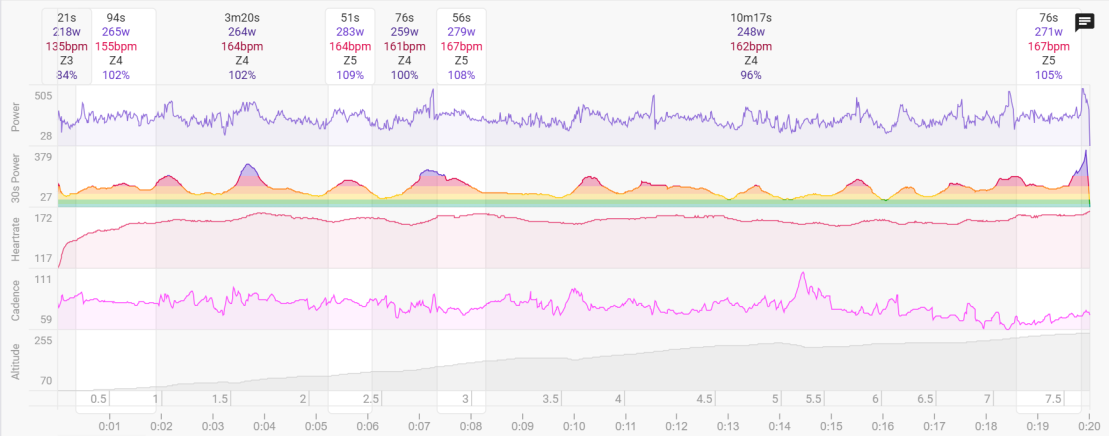
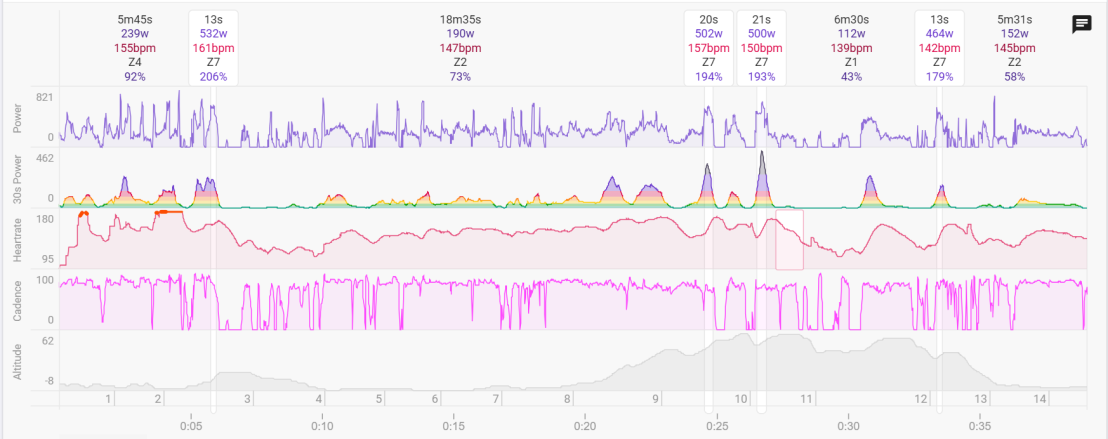
ABOVE: A detailed power analysis graph showing various metrics such as Power, 30s Power, Heart Rate, Cadence, and Altitude during a cycling workout.
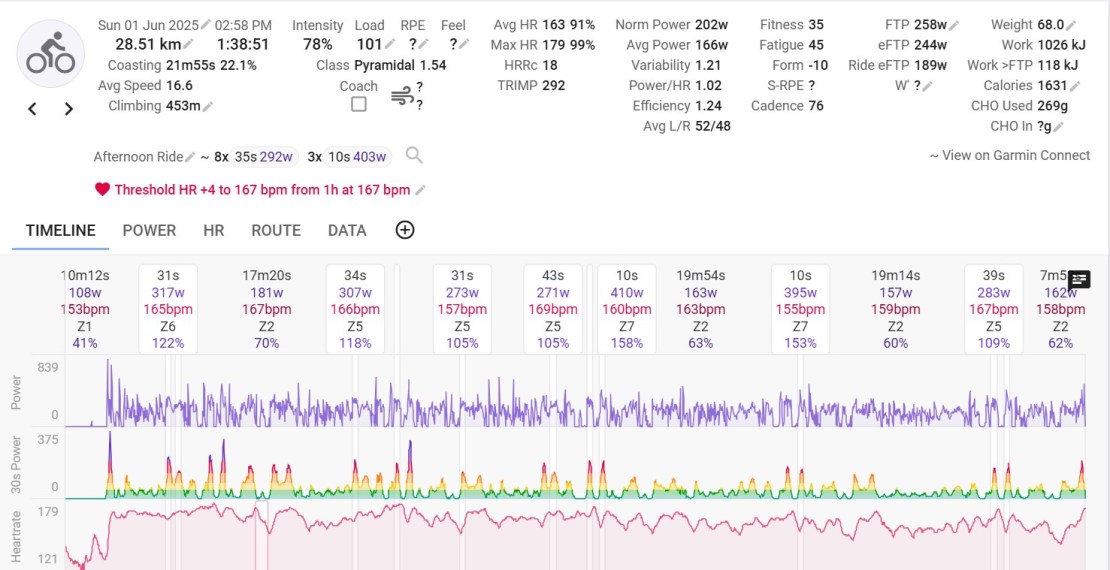
ABOVE: Graphical representation of cycling power data showing various metrics like average speed, heart rate, power output, and thresholds during a bike ride.
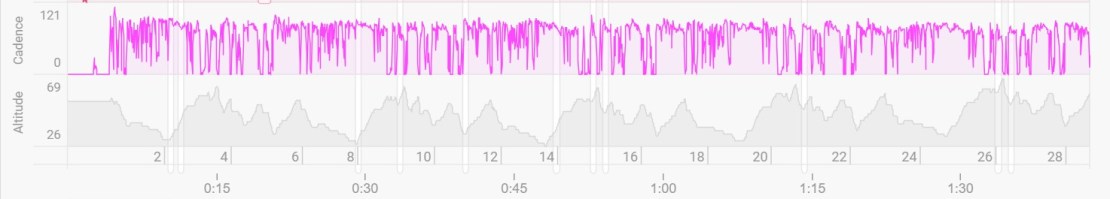
ABOVE: Graph displaying cycling performance metrics, including cadence and altitude changes over time
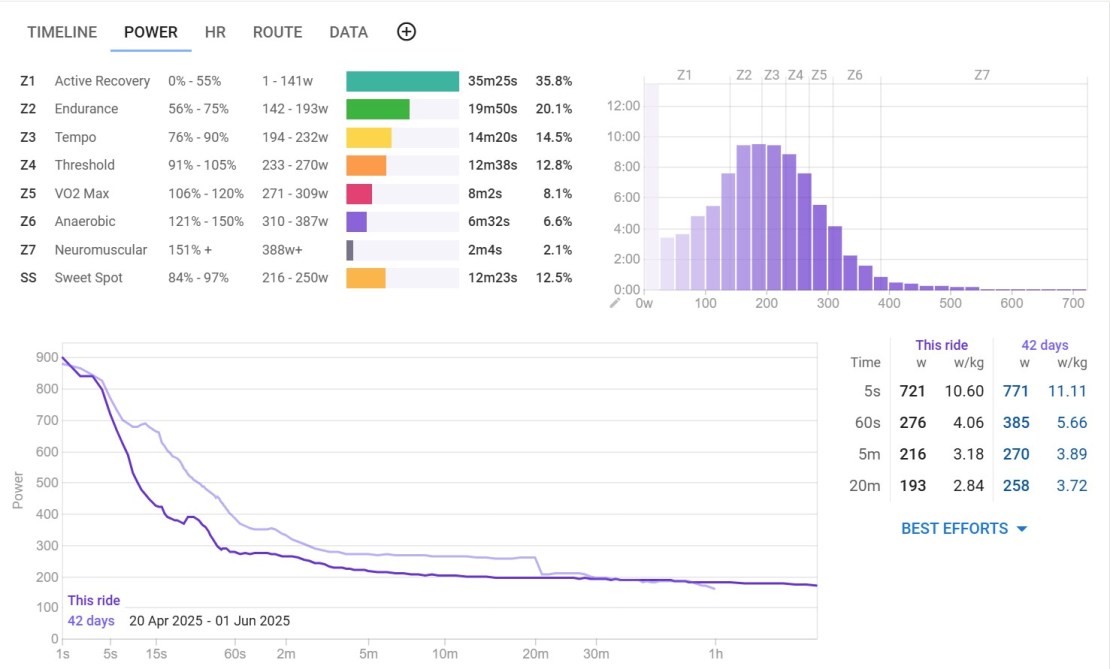
ABOVE: A detailed analysis of cycling power metrics, showing a breakdown of effort zones, total ride power output, and best efforts over various time intervals.
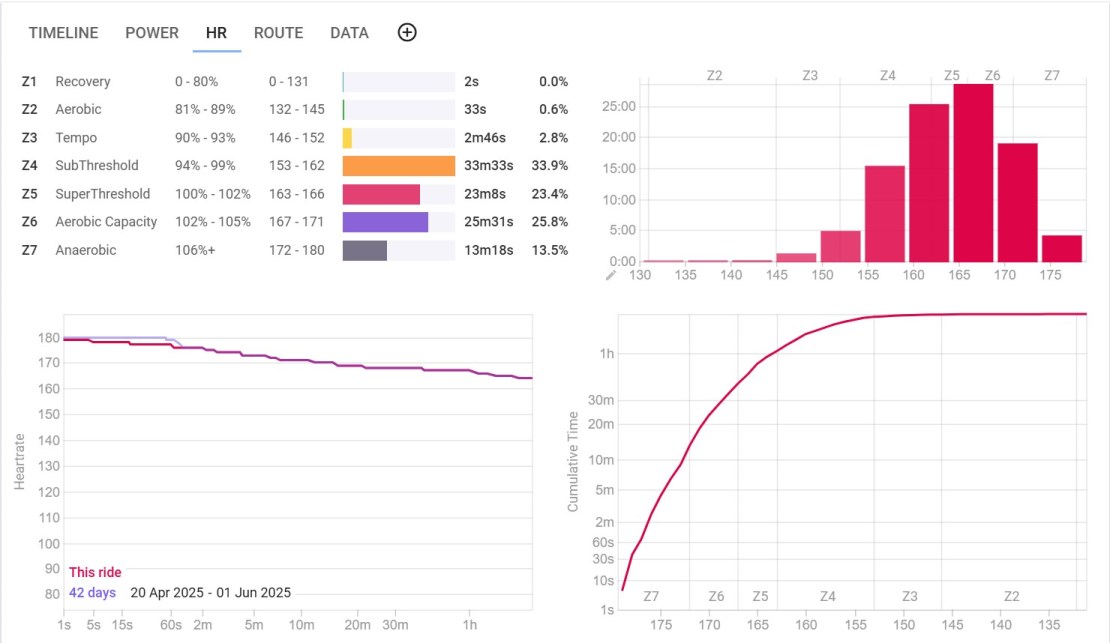
ABOVE: Power meter data analysis for a mountain biking session, showing heart rate, power outputs, and training zones over time.
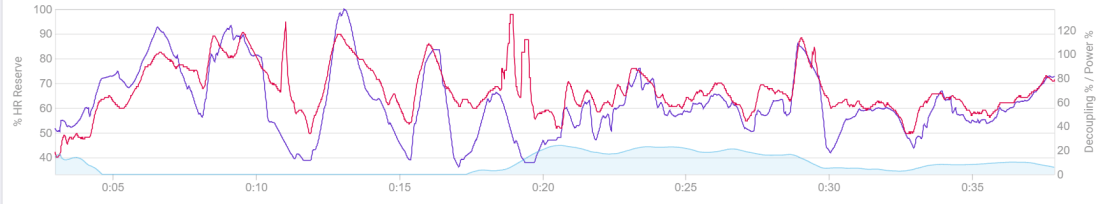
ABOVE: Graph showing heart rate reserve and power decoupling percentages over time during a cycling exercise session.
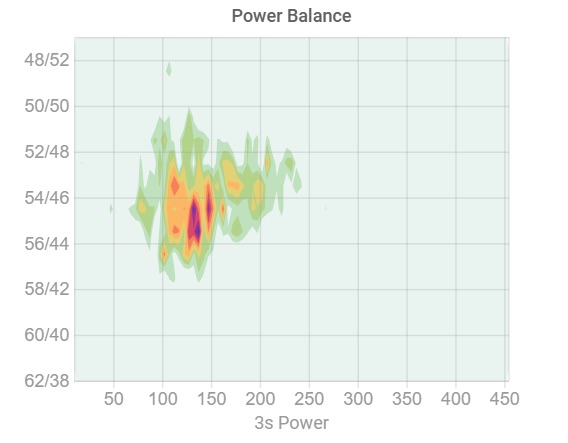
ABOVE: Heatmap illustrating power balance distribution during cycling efforts, showing variations in power output over three-second intervals.

“Spider-mounted power meters are only ever single-sided”
Is that correct? They may only be fitted to one side, but I would have thought the very nature of them means they are measuring both sides as they are measuring power transferred into the drivetrain by the chainring.
How accurate are these at very low power levels. Asking for a friend.
““Spider-mounted power meters are only ever single-sided”
Is that correct? They may only be fitted to one side, but I would have thought the very nature of them means they are measuring both sides as they are measuring power transferred into the drivetrain by the chainring.”
It is incorrect.