Every now and then as a web editor you get random mail that has some advertorial or story punted to you that’s filed under ‘trash’. Here’s an example posted in by some ‘Content Production, Promotion, Training & Consultancy’ company hoping for a bit of web traffic to be pointed at Policy Expert, who I’m guessing sell insurance.
“With the relationship between motorists and cyclists often being reported as at boiling point, Policy Expert has just published the results of a survey into differing attitudes between the two – with some surprising results.” The email tantalisingly begins, before continuing…
“Cyclists fared well in the survey overall, with 15% of motorists saying they wished there were more cyclists on the roads, and a further 30% considering them completely harmless.
Perhaps more surprisingly, the survey also found that 35% of cyclists believe they should have insurance to be allowed to cycle on the road, and a third of cyclists would drink and bike, with 31% saying they would cycle after having two or more pints of beer or large glasses of wine.”
Latest Singletrack Merch


Buying and wearing our sustainable merch is another great way to support Singletrack
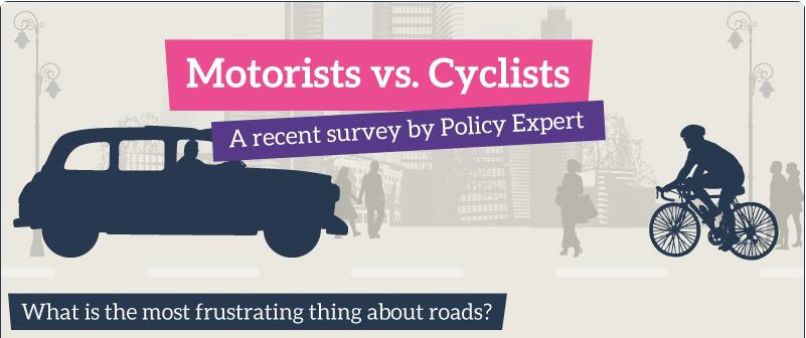
Here’s the whole infographic.

It almost made it to the trash folder after I’d emailed this reply:

“6% of cyclists find speed cameras the most frustrating thing about the roads”
Yeah, there’s one in my village and no matter how fast I blast past it on my bike I can never set the damn thing off.
Who are these “cyclists” and these “motorists”? How did they define them?
It’s a serious question because most cyclists also have a car. In fact I think car ownership is slightly higher among regular cyclists than the general population… so how do they become two separate groups for this survey?
Of course everyone knows there’s no such thing as road tax right? And even they’d named it correctly the fact it’s based on emissions would mean cyclists would pay £0 anyway.
These questionnaire surveys (apparently they interviewed a couple of thousand people) are ridiculously easy to lead – the type and manner of questioning basically makes it ridiculously easy to steer the results towards whatever you like. Without seeing the questions it’s impossible to say if this is the case, but it’s certainly not that surprising to me that a company linked to selling insurance introduces “findings” which conclude that more cyclists should take out insurance..
“Over double the number of men cycle to work” this is meaningless, double compared with what pray tell?
This is the level of a GCSE project, and a bad one at that…
Have they replied back?
As for this:
“6% of cyclists find speed cameras the most frustrating thing about the roads”
Probably because some idiots in cars slow down to about 15mph just in case they set it off and when they are clear speed up to the standard +10mph over the limit.
Typically the local rag picked up on one thing “1/3 of cyclists would drink and ride” (cambridge evening news) I won’t link to it as they don’t deserve the traffic.
Just remember never to spend any money with ‘Policy Expert’
Anyone know any cyclist or motorist that was surveyed for this crap?
Complete balderdash! Biased survey written by a non-cycling motorist and as for the factual content – road tax was abolished by Churchill when he was a junior minister in the 30’s
Sorry you gave them the bandwidth really – more than they deserve!
“Over double the number of men cycle to work”.
I dont understand. What is the comparison against? Did someone proof read this?
Also, those areas in South Wales have a lot of commuters on bikes. Did they just not go there? Or survey people walking to work or in cars instead?
I think the graphic showing cyclist riding up to represent trend up and the graphic conversely showing a downward riding cyclist for a trend down are cool. They get one mark for that effort. Else I think I need to talk to their parents about extra tutoring.